Showing posts with label data graphs. Show all posts

Saturday, August 3, 2013

Visualizing Complex Data

Edward R. Tufte's classic works - Envisioning Information, Visual Explanation, and The Visual Display of Quantitative Information - are milestones in applied epistemology.  Drawings convey meanings across verbal barriers.  But at some level, they must be learned.  A Martian watching a baseball game could probably figure out about half of it in the first two innings. But the other "half" is actually the 90% that brings joy and sorrow to fans.  The classic No Parking sign seems universal, but could mean almost anything.  The Journal of Irreproducible Results published a textured, grainy, and striated image that could save you money by being included as an example in many kinds of research.  (Unfortunately, some scientists do re-use their data, and other people's data, in just such a manner.  See Misconduct in Scientific Research on this blog.)  Humor and fraud help define the limits of the acceptable interpretations of images.  Yet, like a linguistic gold standard, one picture remains worth 1000 words, no matter how many new words we invent.


Many philosophical Objectivists easily assert that in the hierarchy of knowledge metaphysics is the base upon which epistemology rests. However, Leonard Peikoff wrote that the two studies are dependent on each other.
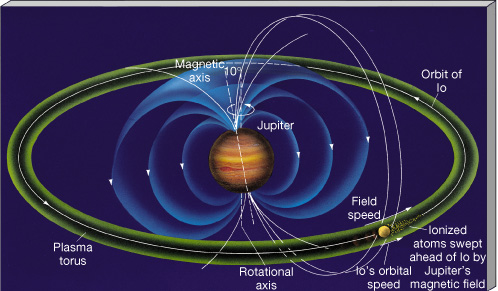
With the Yin-Yang of Metaphysics-Epistemology at the core
the orbiting body could be ethics (morality)
and the field that it generates would be politics.


Computers store information and we connect them in many convenient topologies. Knowledge could be mapped the same way. 
Is the connection geology-geography-geophysics-physics-chemistry a ring or a tree or a mesh?
A Historical Map of Philosophers by Simon Raper at the "Drunks and Lampposts" blog. Raper used a mathematical visualization tool called gephi (see the website here). 
The Continental Tradition is green. Purple dots are British Empiricists 
(including those not actually from the UK such as William James).  
He derived his data from Wikipedia articles citing the influence of one philosopher's work from and then to others, as easily, Plato and Aristotle, Leibniz and Descartes (teal).

The Klein Bottle is to three dimensions what the Moebius strip is to two: it folds into itself, forming a continuous space (or surface).  Here, three Klein Bottles are interconnected. Could this map the way that planetary geology suggests the changes in weather and climate that alter ecological and economic possibilities, causing political changes in social organizations and institutions?


Although he claimed to distrust philosophy, Richard Feynman was not alone among the empirical scientists who suggested that what we perceive as "particles" or "statistical waves" are only the fields which are themselves manifestations of something "deeper" or "beyond." 
In business, firms merge and divest, departments are reorganized, investors take or sell off large interests. In the multi-party politics of Europe, alliances over issues come and go. Consequences that have not been foreseen might not be mappable until after the fact.  

Previously on Necessary Facts
Knowledge Maps
The Genius of Design
Objectified
Art and Copy
Start the Presses: Typeface

Monday, July 8, 2013

Knowledge Maps

Now running on the Objectivist discussion site, Rebirth of Reason, is a set of multilateral exchanges comparing and contrasting the epistemologies of Karl Popper and Ayn Rand.  I believe that independent of partisanship many of the presentations are taxed by a lack of common vocabulary.  

Often, writers intend different meanings from the same word.  This is a hallmark of discussions with Objectivists for whom selfishness is a virtue.  One sub-thread differentiated “risk” from “uncertainty” with different assertions originating in the varied life experiences of the writers.  To engineer Fred Bartlett, a machined bolt of 8.5 cm +/- .03 is unarguably defined.  Is “authority” always unarguable?  Political authority is easily contradicted, but what about the “authority” of reason? 
 
From Frege's Lectures on Logic: Carnap's Student Notes (2004)


Certainly, the Objectivists are not alone in their quandaries.  Every non-trivial communication risks failure, from slight to partial to complete.  Common schooling left us all with the implicit belief that if you can look a word up in a dictionary, you can rely on an objective definition that everyone understands.  However, the important elements of our lives cannot be expressed in a handful of words, delivered as phrases, rather than sentences.  (Dictionaries do include pictures.)  On a different plane of understanding, the Austrian economist Ludwig von Mises acknowledged that capitalists and socialists often agree on the facts – in a certain place, at a given time, some commodity had a known price.  Where they disagree is on what the facts mean.  Such meanings cannot be found in a dictionary.  They require more complicated, nuanced, and subtle explanations, often including analogy and allegory. 
 
In the Star Trek: Next Generation episode “Darmok” 
we met the Tamarians who communicated in allegory. 
(See Memory Alpha here.) 
Tamarian Captain and Jean-Luc Picard.
Picard recites from the Gilgamesh before the wounded Tamarian dies.
Even if the philosophers could decide on a common vocabulary and a common narrative, the primary constraint may be the very dependence on verbal expressions: graphs might serve everyone better.  Outside of information systems, we do not study means of graphical representation, except, of course, for actual artists. 
Order Entry Program Code Documented
with Nassi-Shneiderman Diagram

Microsoft’s Visio delivers many graphical tool sets.  You are not morally obligated to engage the Database shapes and connectors only for the design of databases.  In the machine shop, we neither use screwdrivers as chisels nor calipers as clamps; but, a thousand years ago, when mastodons roamed the streets, my friend Geoff saw VisiCalc for the Apple // and said, “You could make a pretty good word processor with this.” 
 
From Carnap's Notes (2004)
Gottlob Frege developed a graphical representation for logic.  It presaged the notation systems of electricians.  The electrical schematics for series and parallel circuits, for Normally Off and Normally On, led to the circuit logic we accept today.  That much is all fine for planar arrays of linear logic.  What about events that unfold over time?
Star Trek Enterprise, "Cold Front"
Crewman Daniels shows Captain Archer
a map of their problem